This page is no longer being updated as of April 8th, 2022. To follow the evolution of the pandemic in Canada, please visit our new page instead (in french only).
This page is no longer being updated as of April 8th, 2022. To follow the evolution of the pandemic in Canada, please visitour new page instead.
Provinces/Terr.
(last update)
Filter by area
| Most recent numbers
Reported cases
Infected
Active*
Recov.
Deaths
*infected people who have neither died nor been officially considered recovered
| Reported daily cases
Number of cases, since the threshold of 1 case per 100,000 people has been crossed
Countries
Provinces and territories (at least 1,000 cases and 10 deaths)
Qu’est-ce que la COVID-19?
Cette maladie infectieuse découle d’un nouveau virus de la famille des coronavirus, le SRAS-CoV-2, apparu à Wuhan, en Chine, en décembre 2019. Relativement stable, le virus n’a pas donné lieu à plusieurs souches, contrairement à l’influenza. Il accumule toutefois plusieurs mutations. Quelques variants, certains plus contagieux et d’autres présentant une résistance aux vaccins, se sont succédé au fil de la pandémie, dont Alpha (B.1.1.7), Beta (B.1.351), Gamma (P1), Delta (B.1.617.2) et Omicron (B.1.1.529).
Quels sont les symptômes?
Les plus courants s’apparentent à ceux de la grippe ou à un mauvais rhume : de la fièvre, de la fatigue, de la toux et des difficultés respiratoires. Une perte soudaine du goût ou de l’odorat est aussi fréquemment signalée. Certaines personnes éprouvent des douleurs, de la congestion, un écoulement nasal et des maux de gorge. Les symptômes varient d’une personne à l’autre et diffèrent selon les groupes d’âge. Vous pouvez aussi être asymptomatique ou ne ressentir que des symptômes légers. Des formulaires d’autoévaluation, comme celui-ci, sont à la disposition des potentiels malades.
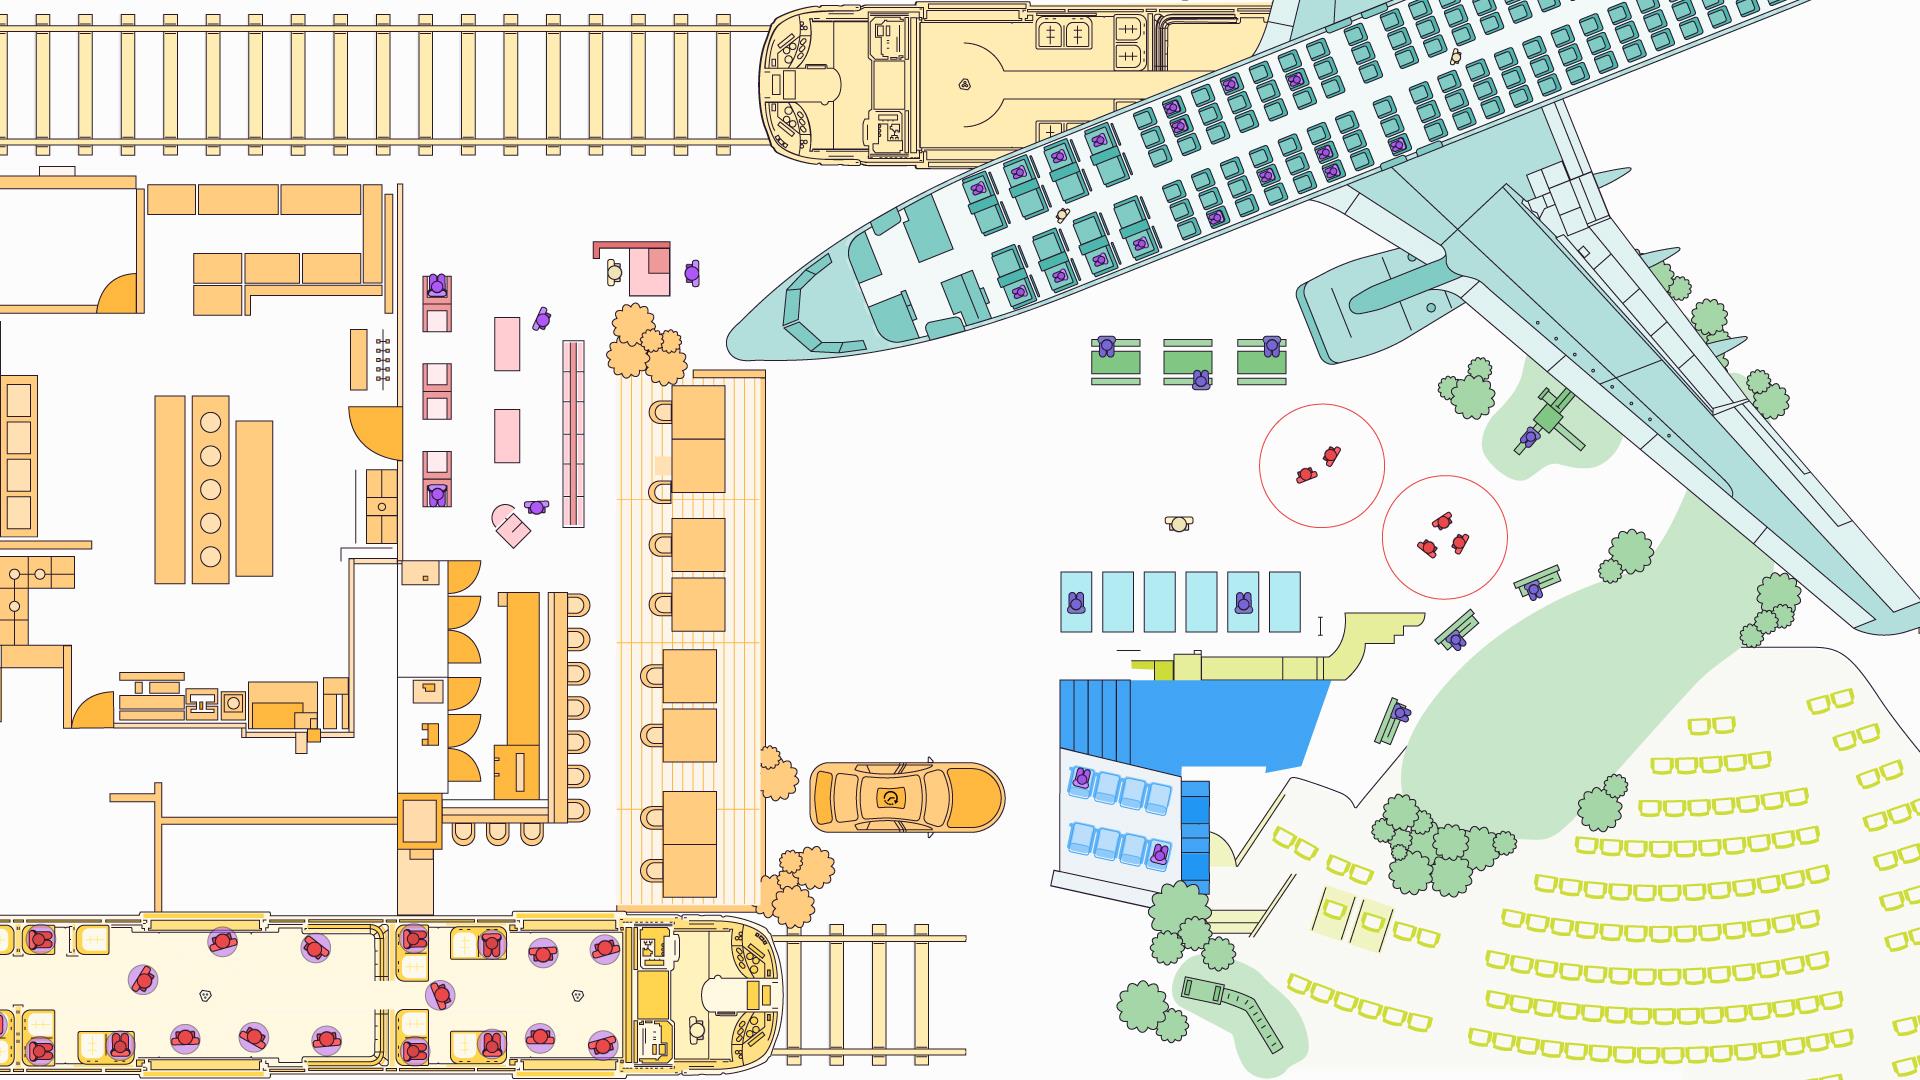
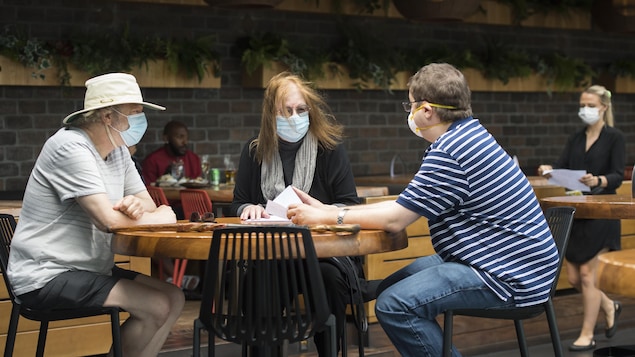
Comment la maladie se propage-t-elle?
Le virus se contracte le plus souvent au contact rapproché et prolongé d’une personne infectée, qui projette des gouttelettes respiratoires en parlant, en toussant ou en éternuant. Des personnes présymptomatiques ou asymptomatiques peuvent transmettre le virus. De la transmission aéroportée, par la présence de plus petites gouttelettes en suspension dans l’air, a également été rapportée dans des lieux clos et mal ventilés. L'hygiène des mains, la distanciation physique, le port du masque, la ventilation et la vaccination sont les mesures sanitaires les plus efficaces pour réduire le risque de contracter la COVID-19.
Les surfaces présentent-elles un risque?
Bien que des gouttelettes respiratoires puissent tomber sur les surfaces environnantes ou que celles-ci aient pu être touchées par une personne infectée, surtout dans un lieu public, les surfaces ne représentent pas un mode de transmission fréquent, contrairement aux contacts directs et à la transmission aérienne. Il est malgré tout important de les nettoyer et de les désinfecter fréquemment ainsi que de se laver les mains régulièrement à l’eau tiède et au savon, pendant au moins 20 secondes, ou avec une solution hydroalcoolique.
Quelles sont les complications possibles?
La plupart des symptômes sont bénins et disparaissent par eux-mêmes, comme pour un rhume ou une grippe. On recommande du repos et de s'hydrater régulièrement. Des médicaments en vente libre peuvent également soulager certains symptômes. Les aînés de 65 ans et plus et les personnes souffrant de problèmes de santé, comme l’hypertension artérielle, des problèmes cardiaques ou le diabète, sont toutefois plus à risque de développer des complications. Les cas les plus graves, qui nécessitent une hospitalisation, résultent en une infection, comme une pneumonie, un syndrome respiratoire aigu sévère, une insuffisance rénale et même la mort. On ignore encore quelles séquelles à long terme, voire permanentes, la maladie peut causer, mais certaines personnes prennent plus de temps à se remettre et d'autres ont développé une forme longue de la COVID accompagnée de symptômes persistants.
Puis-je contracter la COVID-19 à plus d’une reprise?
Les personnes qui ont contracté la maladie sont généralement protégées contre l’infection, mais n’en sont pas systématiquement immunisées. On leur recommande d’ailleurs d’être vaccinées quand même. Des études montrent justement que l'immunité pourrait ne durer que quelques mois et que celle-ci diminuerait rapidement chez les malades asymptomatiques. Des cas de réinfection ont été signalés, mais en particulier chez des patients au système immunitaire affaibli ou dont la première infection remontait à longtemps.
Existe-t-il un traitement contre la COVID‑19?
Pfizer et Merck ont tous deux développé une pilule anti-COVID, nommées respectivement Paxlovid et Molnupiravir, permettant de réduire les risques d’hospitalisation ou de décès chez les personnes contaminées et à risque de formes graves de la maladie. Leur usage est limité. Des antiviraux, comme le remdésivir, sont aussi utilisés pour les patients gravement atteints par la COVID-19, ainsi que du SNG001, pour réduire le risque de développer une forme sévère de la maladie, et des anticorps monoclonaux.
Où en est la campagne de vaccination?
Plusieurs vaccins sur les dizaines en développement ont reçu l’approbation des autorités sanitaires. Ils ont été développés pour prévenir les formes les plus sévères de la maladie, qui peuvent causer une hospitalisation ou la mort. La vaccination est offerte à tous les Canadiens de 5 ans et plus et est toujours considérée comme une arme essentielle pour tourner la page sur la pandémie de COVID-19.
To compile Canadian figures, Radio-Canada collects the numbers published on provinces and territories websites, in addition to the numbers published by the Public Health Agency of Canada. For Quebec data, there may be a delay before the total of confirmed cases, recovered cases and deaths in the regions equals the total for the province. Caution: provinces and countries do not count cases, recoveries and deaths in the same way. The comparisons, although interesting, remain approximate.
Unless specified in the methodology, our numbers reflect the cumulative total of cases as reported daily by governments. We show the data on the date on which citizens became aware of new cases or deaths, even if some may have occurred earlier or at an unknown date.
On March 11, 2022, 411 deaths were removed from the Ontario total. After verification, the province determined that they were not related to COVID-19.
On January 19, 2022, we changed the data source for the total number of cases and recoveries in Nova Scotia. The province has stopped publishing this information on its daily website. We now use figures compiled by the Public Health Agency of Canada for these two variables. We have also corrected the historical data for this province in doing so.
On December 6, 2021, we changed the treatment of hospitalization data in Ontario. On Saturdays and Sundays, only part of the province’s hospitals reports their regular hospitalization figures to the Ministry of Health. This regularly created situation where the number of people in intensive care was greater than the number of people hospitalized, which is self-contradictory. When this situation arises, we now keep the number of regular hospitalizations from the day before. For example, suppose the total number of hospitalizations is smaller than the number of ICU patients on Saturday. In that case, we will exclude the total number of hospitalizations for that day and use the total for the day before, which is Friday. The figures for intensive care are not affected by this situation. So we keep them all.
On September 8, 2021, the number of variants detected in Quebec increased sharply. This is due to the integration of new data by the Institut national de santé publique du Québec, which was not previously included.
Several provinces having stopped publishing the number of variants screened, we stopped publishing it since July 5, 2021. However, we continue to collect and publish the number of variants sequenced.
As of June 25, 2021, we changed data sources for the number of cases, recovered, deaths, first and second doses administered for Quebec. The Ministry of Health and the National Institute of Public Health stopped publishing their figures on the weekend. To continue collecting and publishing statistics at all times, we now use files from the Québec open data portal .
On June 15, 2021, we changed the historical hospitalizations data for Ontario, which also changed the Canadian total. Previously, ongoing hospitalizations excluded intensive care patients whose latest tests were negative. These patients are now counted in. However, unlike other provinces, Ontario still excludes from its total regular hospitalizations for patients who tested negative, although they remain hospitalized due to COVID-19.
On May 11, 2021, we changed the source for Quebec vaccination data. We used to publish data from the Ministry of Health, which compiled its figures according to where the doses were injected. We now use statistics from the Institut national de santé publique du Québec (INSPQ), which compiles its statistics according to the place of residence of people who have received doses, which is more consistent to assess the percentage of the population vaccinated by region.
On March 30, 2021, population statistics for Quebec regions and the provinces and territories of Canada have been updated using the most recent estimates from Statistics Canada and the Institut de la statistique du Québec.
On March 26, 2021, the definition of the number of confirmed variant cases changed in Quebec. Prior to this date, confirmed cases of variants had to go through two steps: screening and sequencing. The screening can detect genetic mutations, but does not identify which strain it is. It is during the second step, genetic sequencing, that the strain is identified. Variant cases are now considered to be confirmed upon screening. We are checking statistics for the other provinces and we will adjust the numbers as we go.
Between December 24, 2020 and January 3, 2021, some provinces temporarily stopped publishing daily data and instead did reviews at certain times. The statistics of certain days during this period can therefore count for several days. This is the case in Quebec.
On December 17, 2020, we added the number of doses of vaccines administered in Quebec and its regions based on data from the Ministry of Health and Social Services. On January 4, 2021, we added the numbers for Ontario from the province's website. For the other provinces and territories, we used data from COVID-19 Canada Open Data Working Group .
On October 7, 2020, we added the number of hospitalizations, people in intensive care and people tested in Canadian provinces and territories. From October 19, we replaced the number of people tested with the number of tests, when available on provincial and territorial websites. On November 5, 2020, we added the number of tests in Quebec regions based on data from the Institut national de santé publique du Québec (INSPQ).
On October 7, 2020, we published the positivity rate for the Canadian provinces. We have been forced to remove this information due to data inconsistencies. On November 5, 2020, we brought this information back for Quebec based on data from the Institut national de santé publique du Québec (INSPQ). On the same date, we also added the positivity rate for Quebec regions.
On October 7, 2020, we also added the number of people having recovered in U.S. states when available, based on data from the COVID Tracking Project (the COVID Tracking Project having stopped its operations, we have stopped collecting and publishing the number of recovered people for the American states since March 18, 2021). For Quebec regions, we added it as well with data from the Institut national de santé publique du Québec (INSPQ).
On July 17, 2020, Quebec changed its way of estimating the number of recovered people. We used data from the INSPQ to correct our historical data to account for this change.
Historical data for Canada and its provinces before March 14, 2020 comes from the Johns Hopkins University, which collects its data from various sources, including the daily reports of the United Nations' World Health Organization (WHO). After March 14, 2020, historical data is collected through our own compilation. We use Eastern Daylight Time (EDT).
International figures are provided from the John Hopkins University and updated daily during the evening. Before August 10th, 2020, we used figures from the website Worldometers.info/coronavirus.
For some countries (such as Spain) or US states (such as California and Florida), the number of people recovered is not available either in Johns Hopkins University data or in the Tracking Project data.
Repatriated Canadian are passengers trapped on the Diamond Princess cruise ship in Japan. They were quarantined at the military base in Trenton, Ontario, after returning to Canada. However, one of these Canadians was unable to return to Canada and died in Japan. He is not counted in the Canadian total number of deaths in this dashboard. A Canadian also died in Brazil and is not counted in the Canadian numbers.
For the graph entitled Daily cases, you can choose between a linear vertical scale (default) or a logarithmic scale. The linear scale increases from unit to unit (1, 2, 3, 4, etc.), while the logarithmic scale is exponential (1, 10, 100, 1000, etc.).
To calculate the rates per 100,000 people, we use figures from the Institut de la statistique du Québec for the regions of Quebec, those from Statistics Canada for the provinces, and projections from the United Nations and the World Bank for the others countries.
Naël Shiab data reporter, Melanie Julien desk editor, Francis Lamontagne and Santiago Salcido designers, André Guimaraes and Mathieu St-Laurent developers, Daniel Blanchette Pelletier reporter